Wondering what percentage of income should go to your mortgage, whether to overpay or invest, or if you should refinance now? This complete mortgage decision guide answers every "s
Every homeowner eventually faces the same cluster of questions. Should I be paying more into my mortgage each month? Is it worth overpaying or should I invest instead? Should I refinance while rates are where they are? What percentage of my income should actually be going to my mortgage? Should my mortgage be paid off before I retire?
These are not small questions. They are decisions worth tens of thousands of dollars — sometimes more — over the course of a mortgage term. Getting them right requires specific numbers applied to your specific situation, not generic rules repeated from a magazine article written in a different rate environment.
This guide answers every one of these questions with current data, worked examples in real numbers, and the honest acknowledgement that the right answer is not the same for everyone. Use the mortgage calculator alongside this guide to model the numbers for your own loan.
Quick-Answer Summary — For Readers Who Need Decisions Fast
Before the full analysis, here are the direct answers to every question this guide covers. Read the full sections for the reasoning and worked examples.
Should I refinance my mortgage? Yes, if the monthly saving covers closing costs within your planned ownership horizon — typically 2 to 3 years. At current rates in 2026, refinancing makes sense if you can reduce your rate by at least 0.75% and plan to stay in the home for more than 2 years.
Should I overpay my mortgage? Yes, if your rate is above 6% and you have 3 to 6 months of emergency savings. If your rate is below 5%, investing the surplus may produce better long-term returns.
Should I pay off my mortgage early? Probably yes if you are within 10 years of retirement. Earlier in life, the answer depends on your rate versus expected investment returns.
What percentage of income should go to mortgage? 28% of gross monthly income for total housing costs (PITI) is the standard guideline. Below 25% provides meaningful financial flexibility. Above 32% begins to compromise other financial goals.
Should I switch my mortgage? Yes, if you are on a lender's Standard Variable Rate or your fixed term has expired. You are almost certainly paying above the best available market rate.
Does using a mortgage calculator affect credit score? No. A calculator requires no credit check and has no interaction with any credit bureau.
Should I Refinance My Mortgage? — The Full Analysis
Direct answer: Refinancing is worth doing when the interest saving over your remaining planned ownership period exceeds the total cost of the refinance. The break-even calculation determines this with precision.
The Break-Even Calculation — The Only Number That Matters
Refinancing has two financial components moving in opposite directions: an upfront cost (closing costs, typically 2%–5% of the remaining loan) and an ongoing monthly saving (from the lower rate).
Break-even months = Total refinancing costs ÷ Monthly payment reduction
If your refinance costs $4,800 and saves $240 per month, your break-even is 20 months — approximately 1 year and 8 months. If you stay in the home longer than that, refinancing saves money. If you sell or refinance again before then, it costs money.
Worked example — US homeowner, mid-2026:
Current mortgage: $285,000 remaining, 22 years left, at 7.5%. Monthly P&I: $2,141. Refinance offer: $285,000 at 6.5% for 22 years. New monthly P&I: $1,944. Monthly saving: $197. Total closing costs: $5,200 (includes origination fee, appraisal, title insurance, attorney fees). Break-even: 5,200 ÷ 197 = 26.4 months — approximately 2 years and 2 months. Total interest saving over 22 years at the lower rate: approximately $52,000. Net saving after closing costs: approximately $46,800.
If this homeowner plans to stay in the property for at least 3 years — which most do — this refinance is clearly financially beneficial.
Worked example — UK homeowner remortgaging:
Remaining balance: £195,000. Current rate: SVR at 7.99% (18 years remaining). Monthly payment: £1,584. New 5-year fix available: 4.49%. Monthly payment: £1,265. Monthly saving: £319. Remortgage costs: £999 arrangement fee + £600 legal/valuation = £1,599. Break-even: 1,599 ÷ 319 = 5 months. Saving over 5-year fix period: £319 × 60 = £19,140 minus costs = £17,541 net.
For a UK borrower on SVR, the break-even is typically just 3 to 6 months because SVR rates are so far above available market rates. If you are on your lender's SVR and have not remortgaged, this is almost certainly costing you £200–£400 per month unnecessarily.
When Refinancing Does Not Make Sense
Refinancing is financially counterproductive when you plan to move within the break-even period. It is also counterproductive when the rate reduction is small — less than 0.5% — and closing costs are high. And it requires scrutiny when your remaining loan balance is small, because the absolute monthly saving is small on a small balance, extending break-even significantly.
For borrowers with prepayment penalties on their current loan — common in some variable-rate products and some non-US markets — the penalty must be added to the refinancing cost in the break-even calculation.
Use the refinance calculator to run your specific numbers, including the impact of different closing cost scenarios.
Should Mortgage Rates Go Down? — What Borrowers Can Expect in 2026
Direct answer: Rate expectations for 2026 favour gradual decline in the US and UK, but the pace and depth of cuts remain uncertain. Rates are unlikely to return to the 2020–2021 lows of 2.5%–3.5% in the foreseeable future.
The Current Rate Environment
In the United States, the Federal Reserve's rate-cutting cycle — which began in late 2024 — has brought the federal funds rate down from its 2023 peak of 5.25%–5.50%. As of mid-2026, 30-year fixed mortgage rates broadly sit in the 6.25%–7.0% range depending on credit profile, loan type, and lender. Market consensus points to continued gradual cuts through 2026 and into 2027, potentially bringing 30-year rates toward the 5.75%–6.25% range by end of 2026 — though this is not guaranteed and depends heavily on inflation trajectory.
In the United Kingdom, the Bank of England base rate sits at approximately 4.25% as of mid-2026, down from its 2023 peak of 5.25%. 5-year fixed rates are broadly available at 4.0%–4.75% for borrowers with 25%+ deposits. Further base rate cuts of 0.25%–0.5% are anticipated through 2026, with possible flow-through to fixed-rate mortgage pricing.
In Canada, the Bank of Canada has cut rates more aggressively than the Fed, with the overnight rate now below 3%. Variable-rate mortgages have benefited significantly; fixed rates have followed more slowly.
In Australia, the Reserve Bank of Australia has begun its own easing cycle after holding rates at 4.35% through 2024, with early 2025 cuts flowing through to variable mortgage rates.
What This Means for Your Mortgage Decision
If you are buying now: Do not wait for rates to fall to a specific target before purchasing. The rate you get today can be refinanced if rates fall significantly. The opportunity cost of waiting — in continued rent payments and potential property price appreciation — often exceeds the benefit of a lower rate achieved 12–18 months later.
If you are refinancing: If your current rate is 7%+ and you can access 6.25%–6.5%, the break-even on refinancing now is typically 18–24 months — reasonable for most homeowners. If you believe rates will fall another 0.75% in the next 12 months, you might consider a 1-year ARM or short fixed term to capture further falls, though this carries the risk of rates moving in the opposite direction.
If you are on a variable rate: In a declining rate environment, staying variable allows you to benefit from ongoing cuts without refinancing costs. The trade-off is payment uncertainty.
Should I Switch My Mortgage? — When Changing Lender Makes Financial Sense
Direct answer: If you are on your lender's Standard Variable Rate (SVR in the UK), or your fixed term has expired and you have not remortgaged, you are almost certainly paying above the best available market rate. Switching is almost always financially beneficial in this situation.
The SVR Premium — What Staying Costs You
In the UK, lenders' SVRs typically sit 3%–5% above the Bank of England base rate. At a base rate of 4.25%, SVRs are broadly 7%–8.25%. The best available 5-year fixed rates for borrowers with 25% equity are currently around 4.0%–4.5%. The difference — 2.5%–4% annually — on a £200,000 balance costs £5,000–£8,000 per year in excess interest.
In the US, the equivalent scenario is an adjustable-rate mortgage that has reset above current fixed rates, or a loan from a higher-rate period where refinancing was not pursued.
How to decide whether to switch:
Step 1: Check your current rate against the best available market rate for your LTV and credit profile. Step 2: Calculate the monthly saving. Step 3: Get quotes for switching costs — in the UK, a remortgage typically costs £1,500–£2,500 including arrangement fee and legal costs; in the US, full refinancing costs £3,000–£6,000. Step 4: Divide costs by monthly saving to find break-even. Step 5: If break-even is within your planned ownership horizon — switch.
Should I Break My Mortgage — Early Repayment Charges
Breaking a mortgage before the end of a fixed or closed term typically triggers an Early Repayment Charge (ERC in the UK) or prepayment penalty (in Canada and some US products). These are structured as a percentage of the outstanding balance — typically 1%–5% in the UK depending on how early in the fixed term you break.
The break calculation:
Outstanding balance: £220,000. ERC rate: 3%. ERC cost: £6,600. Monthly saving from switching: £280. Break-even including ERC: (£6,600 + £1,800 remortgage costs) ÷ £280 = 30 months.
If the new deal runs for 5 years and the saving persists, total saving = £280 × 60 = £16,800 minus total costs of £8,400 = £8,400 net gain.
Whether breaking early is worth it depends entirely on the ERC amount relative to the rate saving and remaining deal term. With 12+ months left on a fixed term with a 3%+ ERC, breaking is rarely worth it unless rates have fallen dramatically. With 3–6 months remaining, ERCs are typically small and the break-even is short.
Check your mortgage offer document for the exact ERC schedule — lenders publish declining ERC percentages year by year through the fixed term.
Should I Overpay My Mortgage? — The Complete Decision Framework
Direct answer: If your mortgage rate is above 6%, overpaying is almost always the best use of surplus income after maintaining an emergency fund and capturing any employer retirement match. If your rate is between 4% and 6%, the decision involves comparing your rate against expected investment returns. Below 4%, investing surplus funds is likely the better long-run mathematical decision.
How Mortgage Overpayments Work
Every pound or dollar of overpayment reduces your principal immediately and permanently. This matters because all future interest is calculated on the remaining balance. An overpayment made today saves your interest rate compounded on that amount for every remaining month of the loan.
This makes early overpayments dramatically more powerful than late overpayments — the same £100 overpaid in year 1 of a mortgage saves more than £100 overpaid in year 20, because it eliminates compounding on a larger remaining balance for a longer period.
Overpayment impact table — £250,000 at 5.5%, 25-year term:
No overpayment: 25 years, total interest £201,478. £100/month extra: 22 years 3 months, total interest £174,200. Saving: £27,278 and 2 years 9 months. £200/month extra: 20 years 1 month, total interest £152,100. Saving: £49,378 and 4 years 11 months. £300/month extra: 18 years 2 months, total interest £133,500. Saving: £67,978 and 6 years 10 months. £500/month extra: 15 years 4 months, total interest £105,600. Saving: £95,878 and 9 years 8 months.
These are conservative estimates. The actual saving compounds further because each month's interest is calculated on a progressively lower balance than without the overpayment.
Is It Worth Paying More Into Your Mortgage?
Yes, in almost all cases where the mortgage rate is above the risk-free alternative. The question becomes more nuanced when comparing overpaying to investing in equity markets.
The guaranteed return argument: Your mortgage rate is the exact, guaranteed, risk-free annual return you earn on every pound or dollar used to prepay. If your rate is 6.75%, overpaying earns a guaranteed 6.75% return. No savings account, government bond, or investment-grade fixed income product currently offers a risk-free 6.75% return. The stock market historically returns more — but historically and on average, not guaranteed and not without periodic significant losses.
The investment argument: Over 20–30 year periods, diversified equity investments have historically returned 7%–10% annually in real terms (before inflation) in the US, UK, Canadian, and Australian markets. If this continues, investing surplus funds earns more than mortgage prepayment at 5% or 6%. But this return is not guaranteed, involves significant volatility, and requires the psychological ability to maintain investments through market downturns without selling.
The practical framework — what to do based on your rate:
Rate above 7.0%: Overpay aggressively after emergency fund and employer match. The guaranteed return exceeds any reasonable risk-adjusted expected return from equity investment.
Rate 5.5%–7.0%: Overpay and invest in parallel. Split surplus roughly 60/40 in favour of overpaying. The guaranteed return is competitive with risk-adjusted investment return, and the security of reduced debt has real value.
Rate 4.0%–5.5%: Lean toward investing but maintain some overpayment for psychological security and guaranteed return. The equity premium over this rate range is meaningful but not dramatic.
Rate below 4.0%: Invest the surplus in tax-advantaged accounts first. The long-run equity premium over very low mortgage rates is historically significant. The exception: if approaching retirement, the certainty of a paid-off home may be worth more than the expected investment premium.
Should I Overpay My Mortgage or Invest? — The Three-Scenario Analysis
Scenario A — High rate, short horizon:
Mortgage: £180,000 at 6.75%, 20 years remaining. Surplus: £300/month.
Overpay route: Pay off in approximately 15 years 2 months. Interest saved: approximately £41,000.
Invest route (assuming 7% annual return): £300/month invested for 20 years = approximately £196,000.
Over 20 years, the investment produces more absolute value — but requires stomach for volatility, consistent discipline not to sell during downturns, and does not reduce the mortgage obligation in the meantime.
Winner at this rate: Investing edges ahead mathematically over 20 years at 7% returns — but overpaying wins on risk-adjusted terms and certainty.
Scenario B — Moderate rate, mid horizon:
Mortgage: £220,000 at 5.25%, 18 years remaining. Surplus: £400/month.
Overpay route: Pay off in approximately 13 years 4 months. Interest saved: approximately £38,000.
Invest route (7% return): £400/month for 18 years = approximately £180,000.
Winner: Investing clearly ahead mathematically, but the behavioural requirement to maintain it through a bear market is the real challenge.
Scenario C — Low rate, long horizon:
Mortgage: £250,000 at 3.75%, 25 years remaining. Surplus: £250/month.
Overpay route: Pay off in approximately 19 years 6 months. Interest saved: approximately £22,000.
Invest route (7% return): £250/month for 25 years = approximately £202,000.
Winner: Investing dramatically ahead mathematically at this rate differential.
The compound interest calculator models the investment side of this comparison for your specific numbers and assumed return, so you can see both paths with your exact mortgage balance and rate.
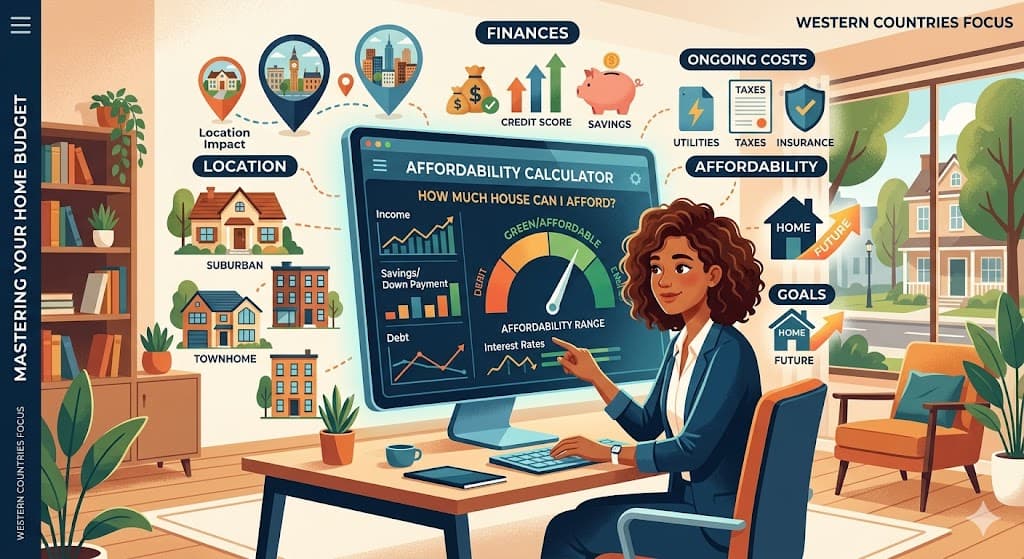
What Percentage Should You Spend on Mortgage? — The Definitive Answer
Direct answer: 28% of gross monthly income is the standard guideline for total housing costs (PITI). For long-term financial health, staying below 25% is advisable. Above 32%, your other financial goals — retirement saving, emergency fund, children's education, debt repayment — begin to be meaningfully compromised.
The 28/36 Rule — Origins and Application
The 28/36 rule is the standard affordability framework used by US conventional mortgage lenders, derived from decades of mortgage default data and formalised in Fannie Mae and Freddie Mac underwriting guidelines.
Front-end ratio (28%): Your monthly PITI payment should not exceed 28% of gross monthly income. This is the housing-cost-specific ratio.
Back-end ratio (36%): Your total monthly debt obligations — mortgage PITI plus car payments, student loans, credit card minimums, and all other recurring debt — should not exceed 36% of gross monthly income.
In practice, many lenders allow back-end DTI up to 45% for conventional loans and up to 50% for FHA loans with compensating factors. This does not mean 45% is advisable — it means 45% is the outer boundary of what lenders will approve. The difference between what a lender will approve and what creates long-term financial security can be substantial.
What Percentage Should You Spend on Mortgage — Across Western Countries
United States: The 28% front-end guideline is the standard. The National Association of Realtors has historically tracked housing-cost-to-income ratios, with affordability defined as 25%–28% of income. In high-cost metro areas (San Francisco, New York, Los Angeles), actual ratios for buyers frequently exceed 35%–40% due to the mismatch between incomes and housing costs.
United Kingdom: The Money Advice Service and UK lenders typically reference housing costs at 35% of net (after-tax) income as the outer affordability boundary. The Nationwide and Halifax affordability indices use a first-time buyer earnings multiple as their primary metric. The general UK financial advice position aligns with 28%–33% of gross income as a reasonable housing cost ratio.
Canada: The Canada Mortgage and Housing Corporation (CMHC) defines affordability as housing costs not exceeding 32% of gross household monthly income for PITI (the gross debt service ratio, or GDS). This is embedded in Canadian mortgage qualification rules — if your GDS exceeds 32%, CMHC-insured mortgages are not available.
Australia: The Reserve Bank of Australia and Australian Bureau of Statistics track housing stress as households spending more than 30% of income on housing costs. Australian financial counsellors typically recommend keeping mortgage repayments below 28%–30% of gross income.
The practical consensus: Across all four major Western housing markets, 28%–30% of gross income is the broadly accepted upper boundary for housing costs as a proportion of income, with the most financially resilient households keeping this below 25%.
How Much More Than Your Mortgage Should You Make?
A useful rule of thumb: your gross monthly income should be at least 3.5 to 4 times your total monthly PITI payment.
At a monthly PITI of $2,000: ideal gross monthly income is at least $7,000–$8,000 ($84,000–$96,000 annually). At a monthly PITI of $2,500: ideal gross monthly income is at least $8,750–$10,000 ($105,000–$120,000 annually). At a monthly PITI of $3,000: ideal gross monthly income is at least $10,500–$12,000 ($126,000–$144,000 annually).
This 3.5–4x income-to-payment ratio ensures your housing costs stay within 25%–28% of income and leaves meaningful room for retirement saving, debt repayment, and financial resilience.
The annual income calculator converts hourly wages, salaries, and variable income to the gross annual and monthly figures used in these calculations.
Should I Pay Off My Mortgage Early? — The Retirement and Wealth-Building Perspective
Direct answer: For most homeowners within 10 to 15 years of retirement, paying off the mortgage early is almost always the right financial decision. For younger homeowners with mortgages below 5%, the mathematical case for investing over prepaying is stronger — but the certainty and psychological value of a paid-off home is worth factoring into the decision beyond the spreadsheet.
The Financial Case for Early Payoff
Guaranteed return equal to your rate. Every dollar prepaid eliminates future interest at your mortgage rate — guaranteed, risk-free. At 6.75%, prepayment earns 6.75% annually with no volatility, no counterparty risk, and no sequence-of-returns risk. Over long periods, broad equity investment has historically earned more — but without the guarantee.
Retirement income security. A paid-off home dramatically reduces the income needed to maintain a comfortable retirement. If your mortgage payment is $1,800/month, eliminating it reduces your required retirement income by $21,600 annually — either reducing the portfolio withdrawal needed or allowing your retirement fund to last significantly longer.
Reduced sequence-of-returns risk. The greatest risk for retirees is a significant market downturn in the early years of retirement, which forces portfolio withdrawals at depressed prices. A paid-off home means one major monthly obligation is permanently eliminated, reducing the withdrawal rate required and giving a portfolio more resilience in down years.
Simplified financial life. No mortgage means no fixed monthly obligation to the bank, no property insurance requirements set by a lender, and full ownership of your largest asset without encumbrance.
The Financial Case Against Early Payoff
Opportunity cost at low rates. If your mortgage rate is 3.5%–4.5%, the historical equity risk premium (the excess return of stocks over risk-free assets) suggests investing surplus funds in diversified equity index funds will produce meaningfully more wealth over 15–20 years than prepaying the mortgage.
Tax-advantaged account priority. In the US, contributing to a 401(k) up to the employer match is always the first priority — the match is an immediate 100% return. Beyond the match, maxing an IRA ($7,000 annual limit in 2026) provides tax advantages that typically outweigh the mortgage interest saving on the same funds.
Liquidity value. Money used to prepay a mortgage is illiquid — it cannot be accessed without refinancing or selling. Maintaining a portion of surplus funds in accessible savings or investments provides financial flexibility that a paid-off mortgage does not.
The Tax Deduction (US-specific). US homeowners who itemise deductions can deduct mortgage interest on loans up to $750,000 (post-2017 Tax Cuts and Jobs Act). For borrowers in high tax brackets with large mortgages, the effective after-tax mortgage rate is meaningfully lower than the headline rate. A 7% mortgage with 32% tax deductibility has an effective after-tax cost of 4.76% — which may change the overpay-vs-invest analysis.
Should Mortgage Be Paid Off Before Retirement?
For most households, yes. The combination of eliminated fixed monthly obligations, reduced required retirement income, and the psychological security of outright ownership makes a paid-off home by retirement an important financial goal for the vast majority of households.
The exception: borrowers with very low-rate mortgages (below 4%) who enter retirement with large, well-diversified investment portfolios may rationally choose to maintain the mortgage — particularly if the portfolio's expected withdrawal return exceeds the after-tax mortgage rate. But this is a sophisticated analysis that applies to a minority of retirees and requires careful modelling of sequence-of-returns risk.
The pension calculator and 401(k) calculator help model how different mortgage and investment decisions interact with your retirement timeline and projected portfolio.
Should I Prepay My Mortgage? — Lump Sum vs Monthly Overpayment
Prepaying a mortgage can be done in two ways: through regular monthly overpayments above the required amount, or through occasional lump-sum payments when surplus funds are available (from inheritance, bonus, or asset sale).
Both reduce principal and save future interest. The mathematical impact of each depends on timing.
Regular Monthly Overpayment — Consistent and Sustainable
Monthly overpayments are the most behaviorally sustainable form of prepayment. They automate the habit, build consistently month after month, and produce steady, compounding interest savings.
On a $350,000 mortgage at 6.75% over 30 years: $100 extra monthly: saves $64,000 in interest, pays off 3 years early. $200 extra monthly: saves $115,000 in interest, pays off 5 years 6 months early. $300 extra monthly: saves $156,000 in interest, pays off 7 years 4 months early.
Lump-Sum Prepayment — Powerful When Timed Well
A lump-sum prepayment made early in the mortgage term saves more than one made late, because it eliminates compounding on the larger early balance for a longer remaining period.
$10,000 lump sum prepaid in year 1 of a $350,000 6.75% 30-year mortgage: saves approximately $38,000 in total interest. Same $10,000 prepaid in year 10: saves approximately $18,000. Same $10,000 prepaid in year 20: saves approximately $6,000.
The same $10,000 saves six times more interest if applied in year 1 versus year 20. This is why financial windfalls — bonuses, tax refunds, inheritances — are ideally applied to the mortgage immediately rather than after a period of deliberation.
Check for prepayment limits before overpaying. Most conventional US mortgages allow unlimited prepayment. In the UK, most fixed-rate products allow up to 10% of the outstanding balance annually without ERC. Canadian closed mortgages typically allow 10%–20% of the original principal annually as a lump sum, plus a similar percentage increase in monthly payment. Australian mortgages with offset accounts allow flexible overpayment through the offset mechanism.
Does Using a Mortgage Calculator Affect Credit Score?
Direct answer: No. Using a mortgage calculator has absolutely no effect on your credit score.
This is one of the most common misconceptions in home buying, and it matters to address directly because fear of credit score impact sometimes stops prospective buyers from researching their options.
Why Calculators Have No Credit Score Impact
A mortgage calculator is a mathematical tool. It takes numbers you enter and applies a formula. It makes no connection to any credit bureau — Experian, Equifax, or TransUnion in the US; Experian, Equifax, or TransUnion in the UK; Equifax, TransUnion, or Equifax Canada in Canada — and sends no data to any lender.
Your credit score is affected only by formal credit applications that trigger what is called a "hard inquiry" — a request by a lender to pull your full credit report as part of an application for credit. Mortgage calculators are not applications. They do not trigger inquiries. They do not appear on your credit report.
What Does Affect Your Credit Score When Getting a Mortgage
Hard inquiries from formal applications do appear on your credit report and temporarily reduce your score by approximately 5–10 points. However, credit scoring models (FICO and VantageScore) apply a "rate shopping" window — typically 14 to 45 days — during which multiple mortgage-related hard inquiries are treated as a single inquiry. This allows borrowers to shop multiple lenders without compounding credit score impact.
What else affects credit during the mortgage process:
Opening new credit cards or loans shortly before applying: lowers the average age of credit accounts and adds hard inquiries. Closing old credit cards: increases your credit utilisation ratio. Missing payments on any existing account: the single most damaging action to a mortgage application credit score. Running up existing credit card balances: increases utilisation and reduces score.
The safe window for calculator use: You can use mortgage calculators, affordability calculators, refinance calculators, and any other online financial tools as many times as you wish with zero impact on your credit. Only when you formally apply — signing a mortgage application and authorising a credit pull — does the credit score impact begin.
Can a Mortgage Calculator — What It Can and Cannot Tell You
This keyword cluster asks what a mortgage calculator actually does, its limitations, and when it gives you the right answer.
Can a mortgage calculator tell you your exact monthly payment? Yes — for principal and interest, a calculator using the correct amortisation formula gives the exact answer your lender's system produces. For total monthly payment including taxes, insurance, and PMI, you need to enter those figures as well.
Can a mortgage calculator tell you whether you will be approved? No. Approval depends on credit score, income documentation, employment history, debt-to-income ratio, property appraisal, and lender-specific criteria that a calculator has no access to.
Can a mortgage calculator tell you what rate you will receive? No. The rate you enter is the rate you assume. Your actual rate depends on your credit profile, loan type, LTV, property type, and lender-specific pricing. Get pre-approved from a lender to find your actual rate.
Will a mortgage calculator be accurate for self-employed borrowers? The payment calculation is accurate for any borrower — the formula depends only on loan amount, rate, and term, not employment type. The affordability calculation is where self-employed borrowers face differences: lenders assess self-employed income differently (typically using 2-year average net profit from tax returns), meaning the income figure to enter for affordability modelling may differ from gross income.
Will mortgage calculator work for interest-only mortgages? An interest-only payment is simply principal × (rate ÷ 12). For a £200,000 interest-only mortgage at 5.5%: £200,000 × (0.055 ÷ 12) = £916.67/month. No principal is repaid, so the balance remains £200,000 at term end regardless of payments made.
Practical Decision Tables — Making the Right Mortgage Choice for Your Situation
Should I Refinance, Overpay, or Do Nothing? — Decision Matrix
| Your Situation | Recommended Action |
|---|---|
| On SVR/variable rate, better fixed available | Switch to fixed immediately |
| Fixed rate within 6 months of ending | Start remortgage process now |
| Rate 2%+ above current market | Refinance — break-even is typically short |
| Rate 0.5%–1% above market, staying 3+ years | Refinance — likely worth it |
| Rate 0.5% above market, moving in 2 years | Probably stay — break-even may not be met |
| Rate below market, in fixed term | Stay and overpay within ERC limit |
| Rate above 6.5%, surplus income available | Overpay aggressively |
| Rate 4%–6.5%, have retirement gap | Split: invest in tax-advantaged, overpay remainder |
| Rate below 4%, maximising investments | Invest surplus, minimum mortgage payments |
| Within 10 years of retirement | Prioritise payoff over investment in most cases |
What Percentage of Income Goes to Mortgage — Quick Reference
| Gross Annual Income | 25% Housing Costs (Max P&I target) | 28% Housing Costs (Max PITI) | 32% Housing Costs (Upper limit) |
|---|---|---|---|
| $50,000 | $1,042/month P&I | $1,167/month PITI | $1,333/month PITI |
| $75,000 | $1,563/month P&I | $1,750/month PITI | $2,000/month PITI |
| $100,000 | $2,083/month P&I | $2,333/month PITI | $2,667/month PITI |
| $125,000 | $2,604/month P&I | $2,917/month PITI | $3,333/month PITI |
| $150,000 | $3,125/month P&I | $3,500/month PITI | $4,000/month PITI |
| $200,000 | $4,167/month P&I | $4,667/month PITI | $5,333/month PITI |
P&I = Principal and Interest only. PITI = Principal, Interest, Taxes, Insurance (total housing cost). Use the 25% P&I column as your target payment when entering loan amounts into the mortgage calculator.
Frequently Asked Questions — Answered Directly for Search and AI
Should I refinance my mortgage in 2026? Yes, if you can reduce your rate by at least 0.75%–1% and plan to stay in the home for more than 2 years. Run the break-even calculation: total closing costs ÷ monthly saving = months to break even. If you are staying longer than break-even, refinance. If you are on an SVR or variable rate in the UK, the case for remortgaging is almost always clear regardless of rate differential.
Is it worth paying more into your mortgage each month? For mortgages above 6%, yes — the guaranteed return exceeds any risk-free alternative. For rates between 4% and 6%, overpaying and investing in parallel is a reasonable strategy. For rates below 4%, the mathematical case favours investing in diversified equities over the long run, though individual circumstances apply.
What percentage should you spend on mortgage payments? 28% of gross monthly income for total housing costs (principal, interest, taxes, and insurance) is the standard guideline across the US, UK, Canada, and Australia. Below 25% provides meaningful financial flexibility. Above 32% begins to constrain other financial goals such as retirement saving and emergency fund maintenance.
Should mortgage rates go down further in 2026? Most economic forecasters expect gradual further rate reductions in the US, UK, and Canada through 2026, with 30-year fixed rates potentially reaching 5.75%–6.25% in the US by year-end. This is not certain and depends on inflation data. For buyers, waiting for lower rates carries the risk of missing continued property price appreciation and ongoing rent payments.
Should mortgage be paid off early — does it affect retirement? Positively, in most cases. A paid-off home by retirement eliminates a major fixed monthly obligation, reducing the portfolio withdrawal rate needed and increasing retirement income security. The exception is borrowers with very low-rate mortgages who enter retirement with large well-diversified investment portfolios — for them, maintaining the mortgage while keeping funds invested may be the better mathematical decision.
Should I break my mortgage to get a better rate? Calculate the break-even: (ERC cost + switching costs) ÷ monthly saving = months to recover costs. If you plan to stay beyond break-even, breaking may be worth it. If your fixed term has 12+ months remaining with a 3%+ ERC, it is rarely financially beneficial unless the rate saving is very large.
Does using a mortgage calculator affect my credit score? No. A mortgage calculator requires no credit check, triggers no hard inquiry, and sends no data to any credit bureau. Your credit score is entirely unaffected by any number of calculator uses. Only a formal mortgage application triggers a hard inquiry and potential minor temporary score impact.
Can I afford a mortgage calculator — how do I use it to check affordability? Take 28% of your gross monthly income as your maximum PITI (total housing cost including taxes and insurance). Subtract estimated monthly taxes and insurance (typically $300–$600 for a mid-range US home). Enter the remainder as your target P&I payment in the calculator, then adjust the loan amount until the output matches. This gives you your maximum affordable loan at any given rate and term.
How much more than your mortgage should you make? Your gross monthly income should ideally be at least 3.5–4 times your total monthly PITI payment. At a $2,000 monthly payment, aim for at least $7,000–$8,000 gross monthly income ($84,000–$96,000 annually).
Should I overpay my mortgage or keep savings? Always maintain 3–6 months of accessible emergency savings before overpaying. Once that buffer is established, overpaying a mortgage above 6% is typically a better financial decision than holding excess cash in a savings account earning 4%–5%. If your mortgage rate is near or below current high-yield savings rates, the trade-off is closer — and liquidity (keeping cash accessible) has genuine value.
Complete Tool Suite — Everything You Need to Act on These Decisions
The mortgage calculator is the starting point — enter your current loan details to see your monthly payment and total interest cost, then adjust rate and term to model refinancing scenarios.
The refinance calculator takes you further — it calculates your break-even period for any refinance scenario including closing costs, so you can determine definitively whether refinancing saves money for your planned ownership horizon.
The mortgage house affordability calculator answers the affordability question from the income side — entering your income, existing debts, and down payment to produce a maximum purchase price, maximum loan amount, and the payment that keeps you within the 28% guideline.
The home loan EMI calculator provides a month-by-month amortisation breakdown of any loan, showing precisely how the interest-to-principal split changes over time and the impact of different payment amounts.
The compound interest calculator models the investment alternative to mortgage overpayment — enter the surplus amount, assumed annual return, and time horizon to see projected portfolio value alongside the interest saving from overpaying.
The savings goal calculator helps you build the emergency fund that should exist before any surplus funds go to mortgage overpayment — setting a target and calculating exactly how much to set aside monthly to reach it.
The 401(k) calculator and pension calculator project retirement portfolio growth under different contribution scenarios — helping you model the retirement impact of redirecting former mortgage payments once the loan is paid off.
The debt calculator provides a complete picture of all your financial obligations — mortgage, car loans, student debt, credit cards — showing how total debt changes under different payment strategies and which payoff sequence minimises your overall interest cost.
The annual income calculator converts hourly wages, freelance income, and variable compensation to the annual and monthly gross figures used in every mortgage affordability calculation.
Every question in this guide has a clear answer — but the right answer for you depends on your specific rate, your loan balance, your income, your other financial goals, and how many years you plan to stay in your home. The tools above let you model your specific numbers rather than relying on general rules.
Run your calculation. Know your number. Make your decision with confidence.
This guide is for informational purposes only and does not constitute financial advice. Mortgage decisions depend on your individual circumstances. Consult a licensed mortgage advisor or financial planner before making any borrowing or repayment decision.
Written by the WithinSecs Finance Editorial Team · Last reviewed: May 2026 · Reading time: approximately 18 minutes
Recent Articles

Mortgage Calculator — Calculate Monthly Payments, Affordability, and the True Cost of Any Home Loan

Mortgage Calculator — Calculate Your Monthly Mortgage Payment Instantly

What Is the 28/36 Rule for Mortgages? Full Guide